Environment
Strategy to reduce GHG of existing ships
Strategy to reduce GHG of existing ships
Yoshikazu Tanaka (Senior Managing Director, MOL Techno-Trade, Ltd. )
1. Introduction
This column is an edited version of an article written for the June 2020 issue of the monthly magazine, Jointly Owned Ships of JRTT (Japan Railway Construction, Transport, and Technology Agency).
At the IMO conference in 2018, member countries agreed to "aim for zero greenhouse gas emissions from ships by the end of this century" and set a target to "halve emissions by 2050 (compared to 2008). In fact, due to the expected increase in trade volume, a reduction of more than half, 70 to 80 percent, is required.
It is difficult to achieve only by improving the hull form and the performance of the engine as an extension of the conventional approach.
This phase is one in which we should make use of hardware and software, alternative fuels, and all available resources. First, we will introduce the potentials of reducing energy losses of existing ships.
2. Improvement through maintenance
2.1 Reduction of frictional resistance
(1) Recovery by full-surface sand-blasting
The frictional resistance occupies more than 60% of the total resistance of today's ocean-going ships. Container ships and car carriers used to sail at high speeds in
the past are now generally operated at low speeds, the pressure resistance and wave-making resistance components are now less than 40% of the total.
Since frictional resistance is naturally influenced by the surface roughness of the bottom surface of the hull, then hull maintenance is important.
Fig. 1 shows a ship in quite a poor condition, but the boot top section between the ballast draft and the full draft has been rubbed and rusted by the quay fenders. This is unavoidable by the mooring method used today that the hull is shifted upwards when unloaded and down-wards when loaded. Even if this rust is removed at the dry dock and the paint is touched up, the paint surface is still uneven.
According to MOL's research, the rate of aging deterioration of a ship's propulsion performance is said to be 0.06 kt/year, which can be as high as 0.6 kt in 10 years.
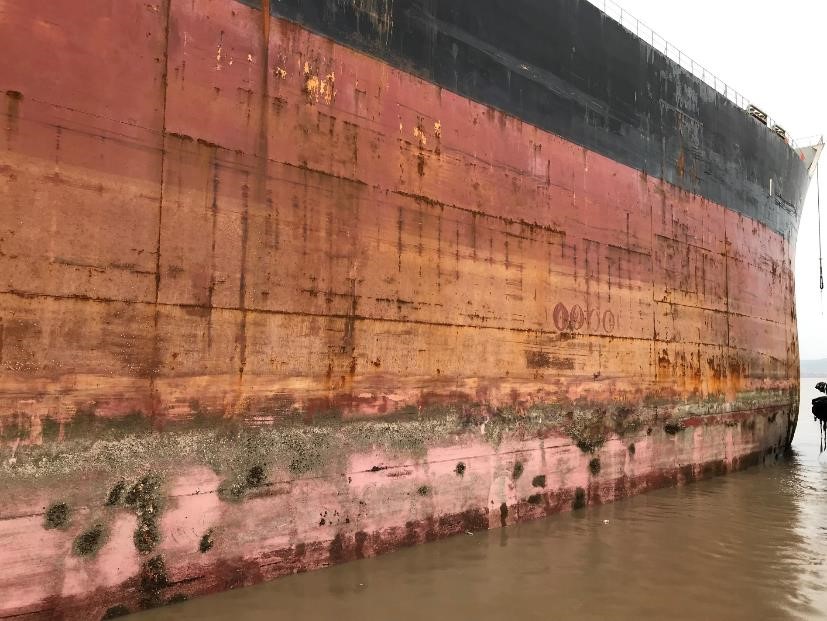
Fig.1 A ship with rusted sides
This amount becomes about 15% in terms of horsepower loss. Some shipowners sand-blast and re-paint the entire bottom of the ship at certain timing (such as 15 years after built), but it is still not common.
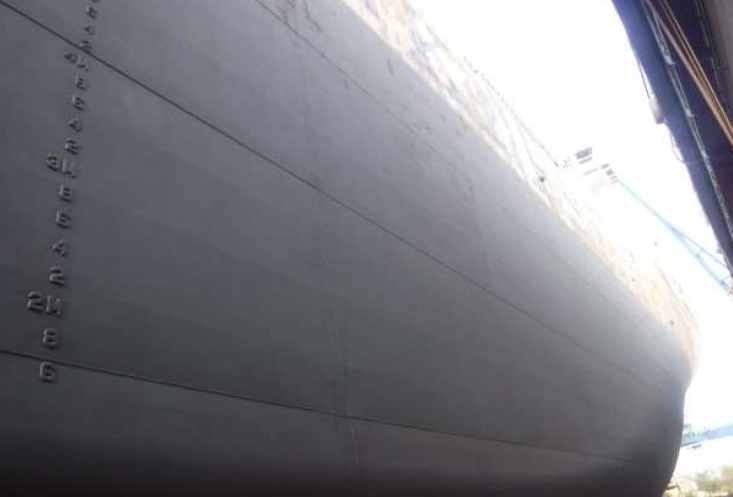
Fig.2 Shipside after full surface sand-blasting
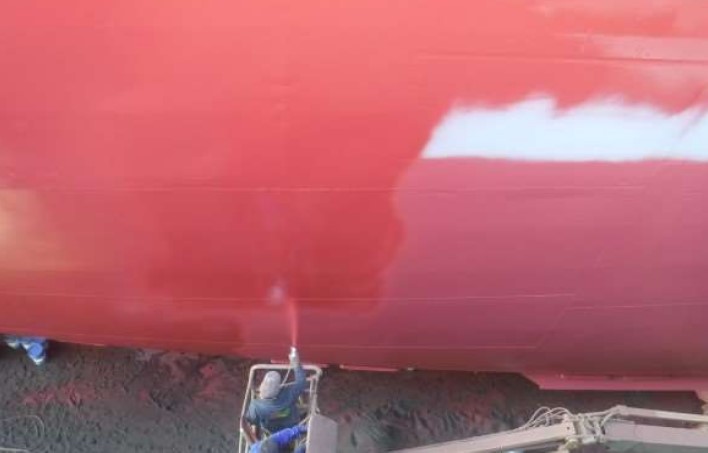
Fig.3 Shipside under full re-painting
In Fig. 2, the metal surface is visible after full surface sand-blasting, and in Fig.3, the full surface is being re-painted. Quite frankly, the surface will be much, much smoother than a new ship painted on the patchworks of block construction.
(2) Shortened dock intervals
The loss due to this deterioration in surface roughness is the case when no marine species is attached, and if marine species are attached, the horsepower loss will be even larger.
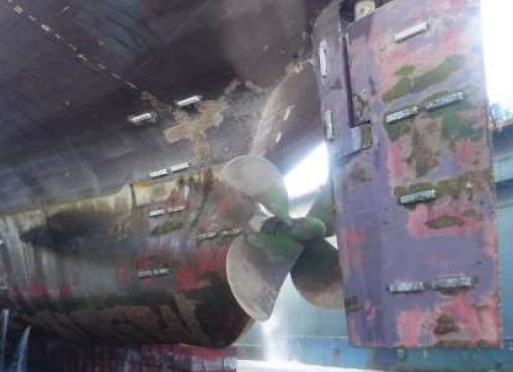
Fig.4 Shipside with general biofouling
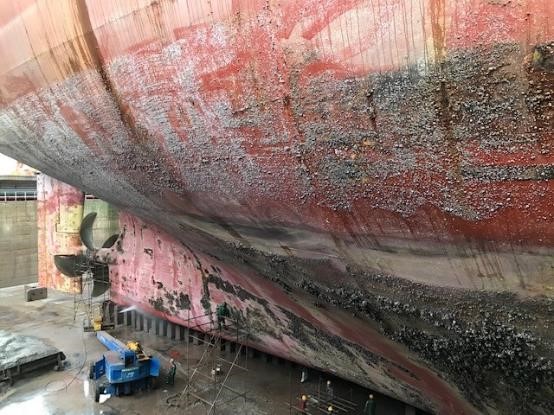
Fig.5 Ship's side with severe biofouling
Fig.4 shows the stern section of the sand-blasted ship (Fig.2&3) just after the dock in. Fig.5 is a terrible case with large barnacles, and the horsepower loss is likely to be as high as 30% to 40%.
I want to introduce a specific case in which we investigated the effects of fouling on the bottom of a newly built ship.
Fig.6 shows that after about 3 months of outfitting period (when the ship was in light condition, the draft was about 1/4 of the full load, and the upper part was clean), there were a few small barnacles on the bilge keel and the flat part of the bottom of the ship, and a little slime on the propeller. And there was a little slime on the hull under the lightship draft.
Before and after the removal of this fouling, two sea trials were conducted to confirm the differences, and the horsepower loss was 6.6%.
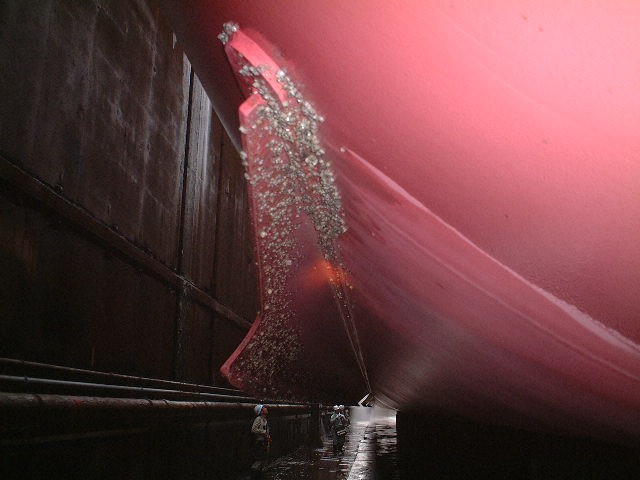
Fig.6 Bio-fouled bottom of a newly built ship
The condition of the bottom of this new ship is considered better than that of most of the ships in service, since most of the side of the ship was not submerged, and there was no significant fouling.
In other words, normal service ships are losing more horsepower than this case.
Therefore, some shipowners suggest that shortening the dock interval to keep the bottom condition is more cost-effective. When the cost of fuel is higher, the measures must be adapted.
2.2 Improving the fouling and deterioration of the engine
Here we Introduce the deterioration of fuel economy due to diesel main engine fouling and age deterioration. Fig.7 shows a conceptual diagram of the deterioration of fuel efficiency reported in SR235(Report No.235 by Japan Ship Research Association), and the fuel economy rate worsens due to soot fouling and wear. Combining all of this together, it comes out to about 10% of power loss.
The turbocharger, air cooler, fuel pump, and fuel valve are the facilities that have a significant impact on engine performance, and by cleaning them and replacing worn parts, fuel efficiency can be restored.
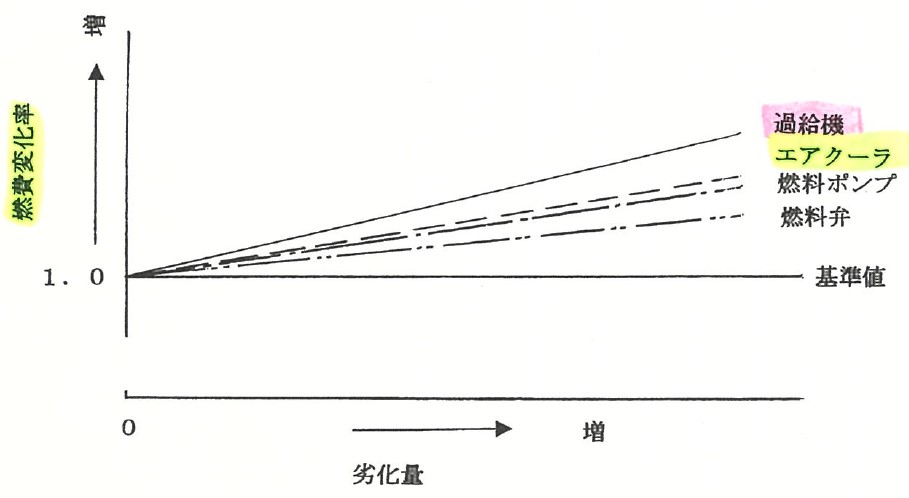
Fig. 7 Deterioration of engine parts and decreased fuel efficiency
For one sample, the spray of three of the seven fuel valve nozzles was poor, and when the fuel efficiency was compared before and after the replacement of three nozzles, the fuel efficiency was improved by about 2% in the case.
3. improvement through operations
3.1 Improving Early Arrival Loss
Since CO2 emissions per ton-mile increase with the square of the ship's speed, it is indisputable that low-speed operation is effective in reducing GHG emissions.
The reduction in early arrival losses cannot be disregarded. If a car carrier to arrive 4 hours earlier on the North Pacific route, it would need to increase its speed by 1.6%, resulting in a fuel loss of about 3.2%. 20 hours early arrival would require an 8.3% increase in speed, resulting in an increase in fuel consumption of about 17%. 20 hours early arrival is often seen, so this is a level that needs to be improved.
3.2 Weather forecasting and route selection
The actual sea performance during the disturbance is not proved clearly in the industry until now, because there are a lot of uncertainties and lack of accuracy. Efforts are now underway in many countries, and everyone is surprised at the magnitude of the losses.
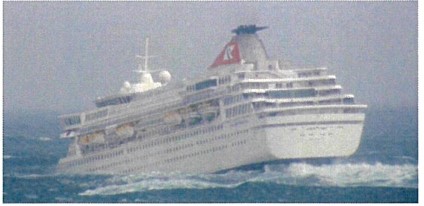

Fig.8 A cruise ship pitching in a swell
The cruise ship in the wave in the picture in Fig.8 is a situation where the safety of passengers is threatened, and its horsepower loss is likely to be more than 100%. (More than double the fuel consumption.)
While all cruise ships usually operate to avoid dominant low pressure, but they should be aware of the swell, which is closely related to horsepower loss.
Since pitching caused by swelling is the biggest cause of horsepower loss, we are also developing countermeasures to suppress pitching.
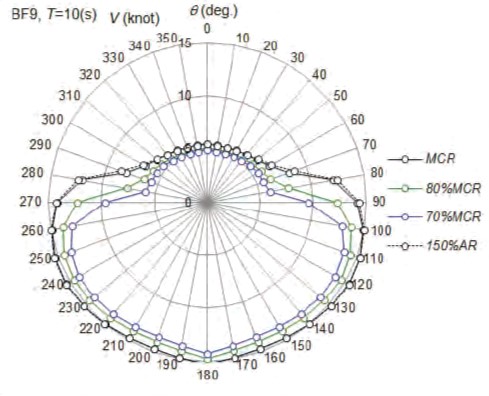

Fig.9 The direction of swell and speed down
Fig.9 shows the direction of the swell and the decrease in ship speed, from the National Maritime Research Institute, showing the situation where a 15kt ship could only produce 5kt by MCR horsepower in a frontal swell during BF9. It also shows that the swell from the side or behind does not affect the speed of the ship.
With the use of Weather News' information, it has become commonplace to avoid rough weather and find the best route to take. The technology for forecasting the course of low-pressure has improved, and it is now easy to avoid low-pressure.
However, since a long period swell (which affects a bad influence for ocean-going vessels) propagates from a very long distance and is not directly related to a nearby low-pressure.
Then we should pay attention to swell, not only low-pressure.
4. Summary
For example, recovering the aging deterioration of the ship's bottom (sand-blasting the entire surface every 10 years) averages 10% recovery over 20 years, and a further 10% is recovered on average by shortening the dock interval and not leaving the fouling condition in place.
If we put 5% recovery on improving operations during waves (avoiding large swells from the front), 5% recovery on improving engine fouling, and 5% recovery on improving early arrival loss, then we have a total recovery of 35%.
Unlike automobiles, the ship industry is divided into designers, builders, owners, operators, ship managers, and crews, which makes it difficult to achieve overall optimization. Therefore, there are cases in which the various energy losses described in chapters 2 and 3 are not noticed.
The first thing to do is to reduce these losses so that ships can operate with less energy, not only to reduce fuel consumption but also to reduce GHG emissions.